Uniswap Monthly Financial Report & Analysis - April ‘24
This report covers the performance of the Uniswap Protocol and UNI token leading up to and including April 2024.
Table of Contents
Executive Summary
Multichain (Volume, Liquidity, Fees)
Market Share (Volume, Liquidity, Fees)
Layer1 vs Layer2 (Volume, Liquidity, Fees)
Second-Order Values (Protocol Efficiency, Fee Rates, Protocol Yield)
UNI Token
Executive Summary
In April 2024, the Uniswap Protocol processed $77.48 billion in monthly volume (-14%) across $6.26 billion in liquidity (-11.9%), earning market makers $125.29 million in fees (-21.3%).
Across all chains, Ethereum saw the most Uniswap volume with $42.3 billion in v3 pools, seconded by Arbitrum. Scroll had the highest month-over-month growth in volume and fees.
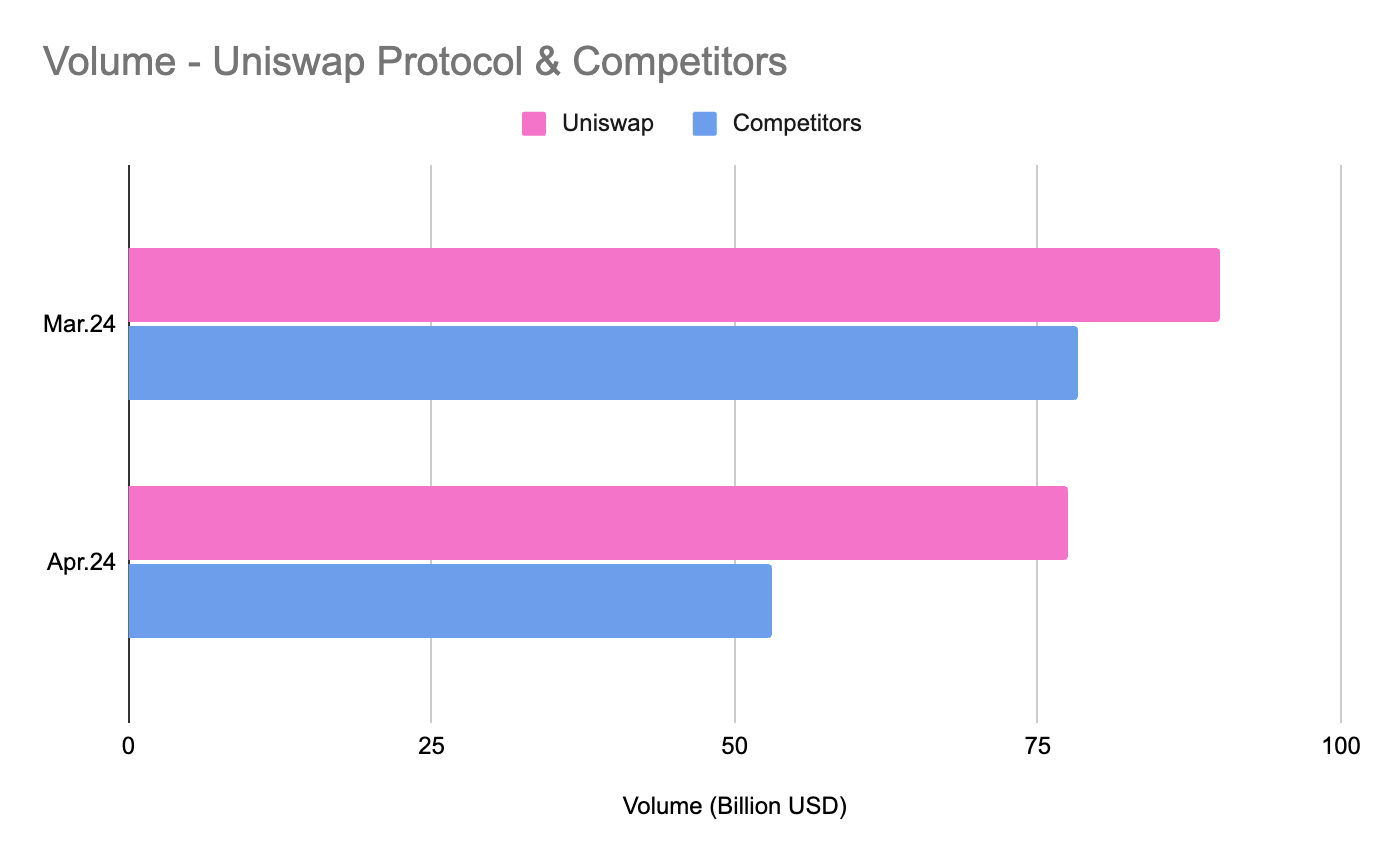
This month, the protocol experienced a relative increase in volume (+5.9%), liquidity (+1.2%), and fees (+5.1%) over competing DEX protocols.
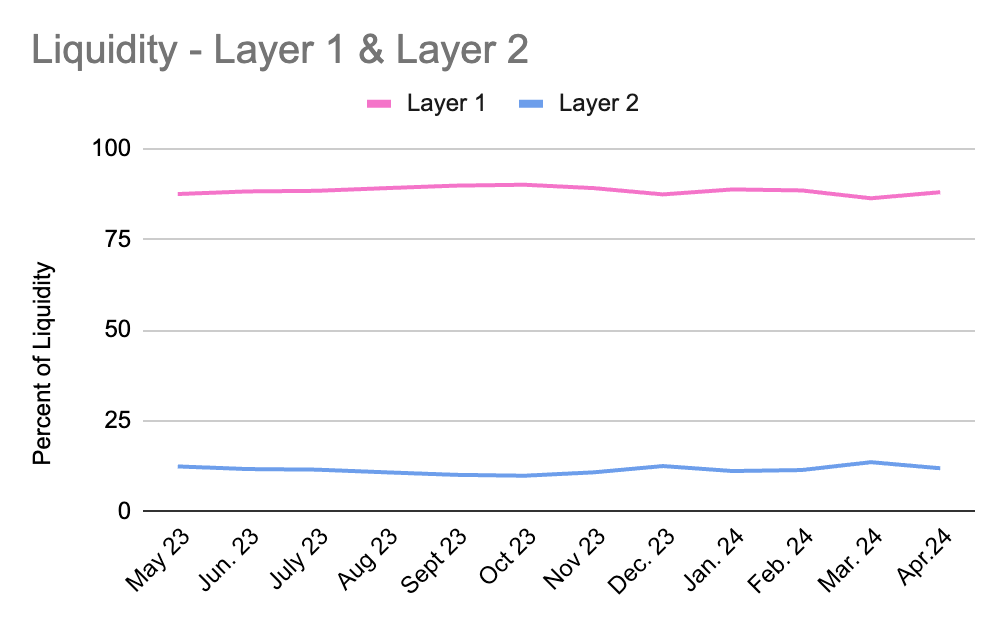
Layer 2 deployments received 32.7% of all Uniswap volume, and liquidity fell slightly to 12% of the total. However, they generated 29.2% of fees, a new all-time high.
Three Uniswap v3 deployments were added to the report this month: Filecoin, Blast, and Linea.
Multichain
This section highlights activity across each major chain with a Uniswap deployment and informs on the absolute growth of the Uniswap Protocol and its relative growth across multiple chains.
Only chains with high-quality API data are included.
Volume
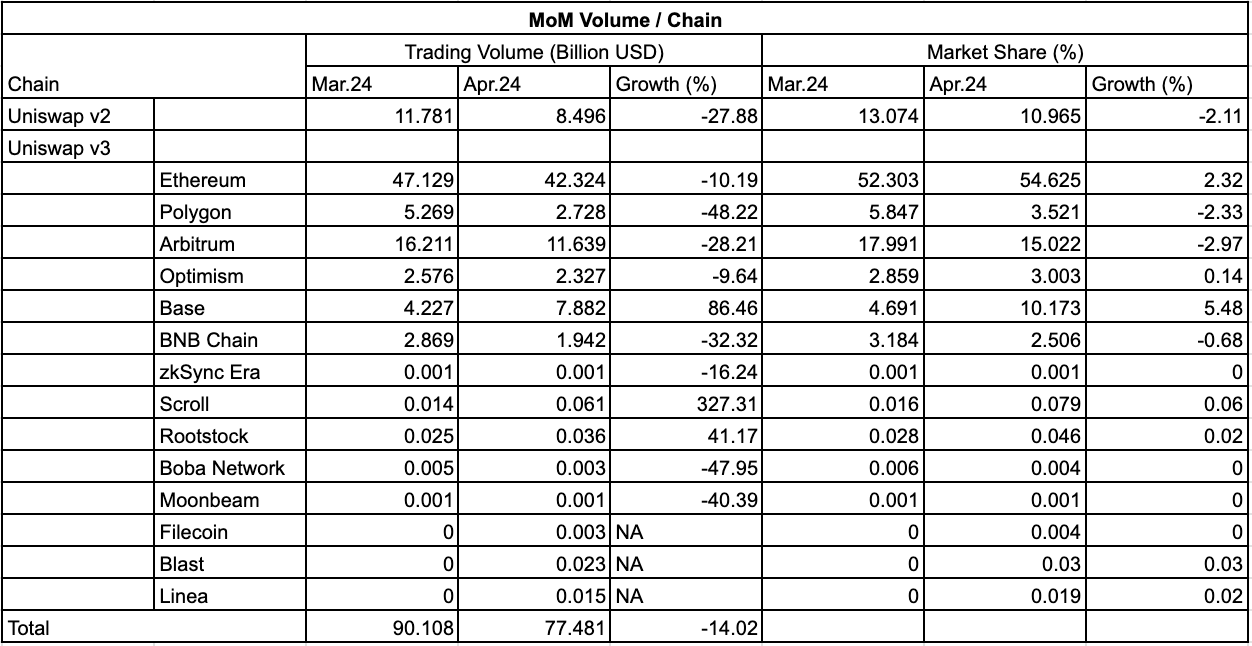
In April, the Uniswap protocol experienced a slight drop in volume, down to $77.48 billion (-14%), but it still marked the second-highest monthly volume of the year.
Base, Scroll, and Rootstock were the only chains with month-over-month volume growth, with the rest contributing to this month’s fall-off. Scroll was the biggest winner, with a 327.3% rise in volume, and Polygon and Moonbeam were on the other side of the spectrum with nearly 50% declines.
Relatively, Base saw the largest increase in volume share for the third month running, now sitting at 10.2% of total Uniswap protocol volume. Uniswap v3 on Ethereum also grew its market share slightly despite seeing an absolute decline of 10.2%. Uniswap v3 on Ethereum continues to make up around half of all protocol volume.
Liquidity
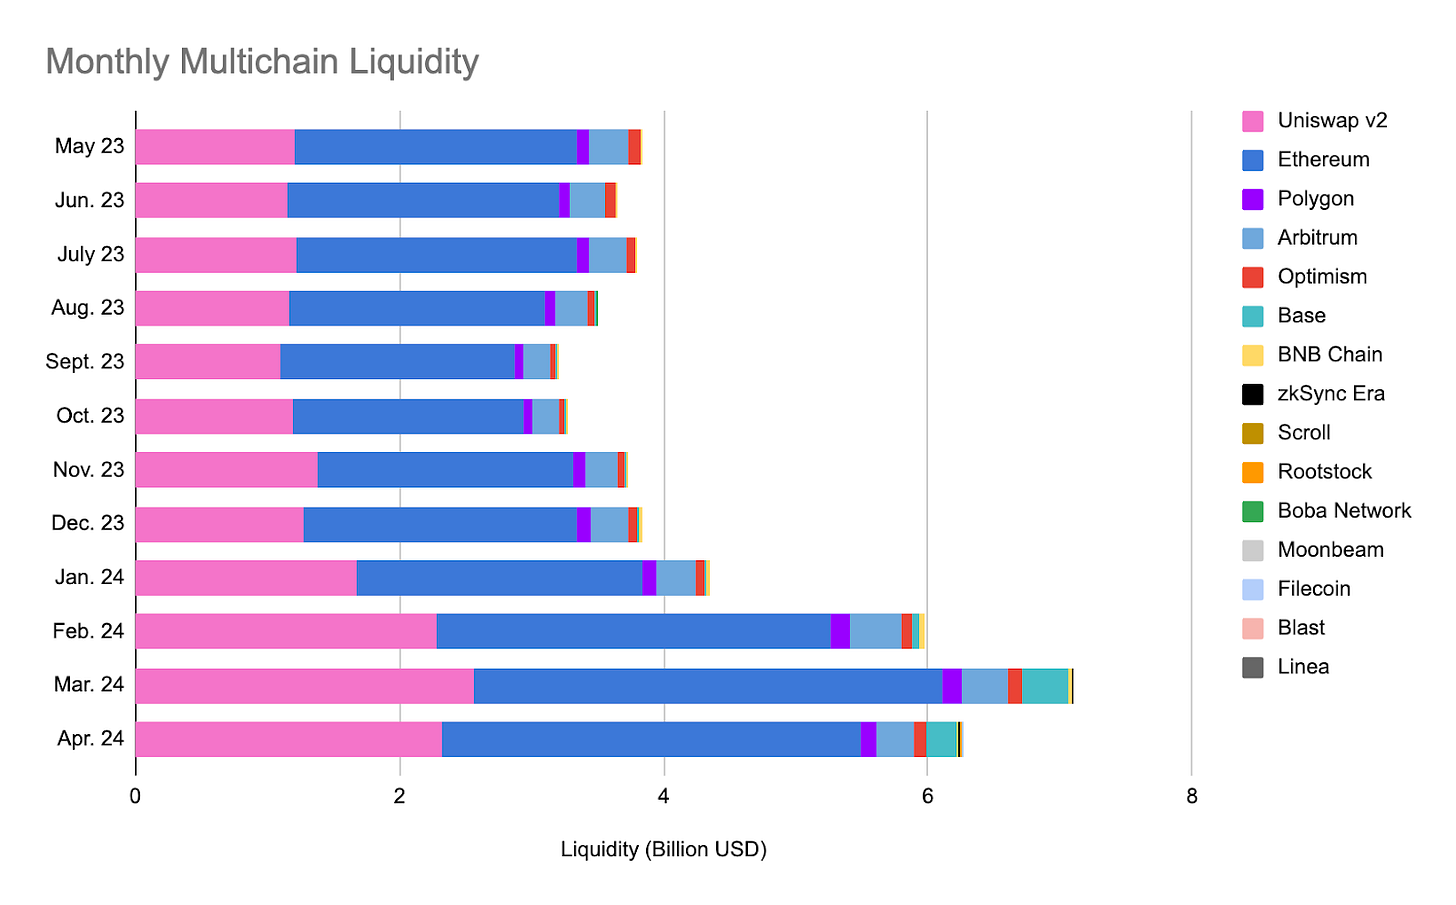
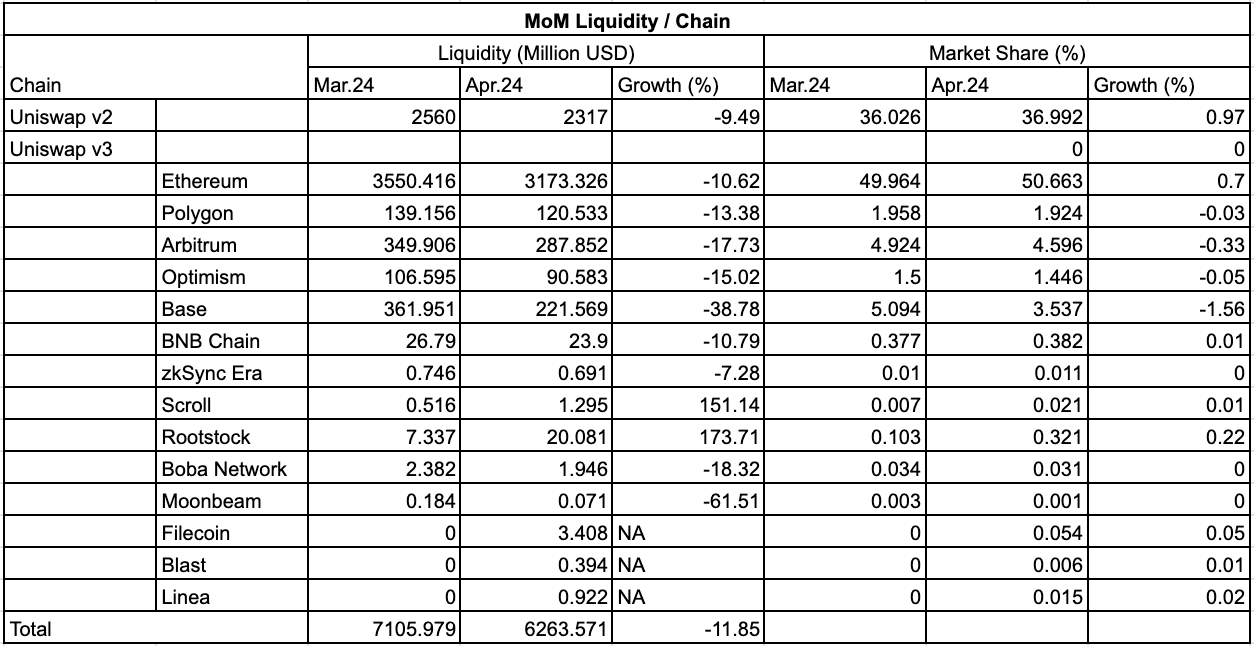
Uniswap protocol liquidity fell this month for the first time since Sept. 2023, down to $6.26 billion across all chains. Despite the decline, the protocol maintains more liquidity than in February of this year. Since liquidity is dollar-denominated, it’s important to note that declines are not necessarily outflows but can represent deprecation in months with negative price action, like April.
The Rootstock and Scroll deployments were the only ones to see an increase in TVL in April, each marking an increase of over 150%. Moonbeam and Base had the largest falls in liquidity at -61.5% and -38.8% respectively.
As usual, there were few changes to the liquidity market share. The greatest delta was a 1.56% fall in dominance from Base.
Uniswap v2 and Uniswap v3 on Ethereum continue to hold over 87% of the liquidity.
Fees
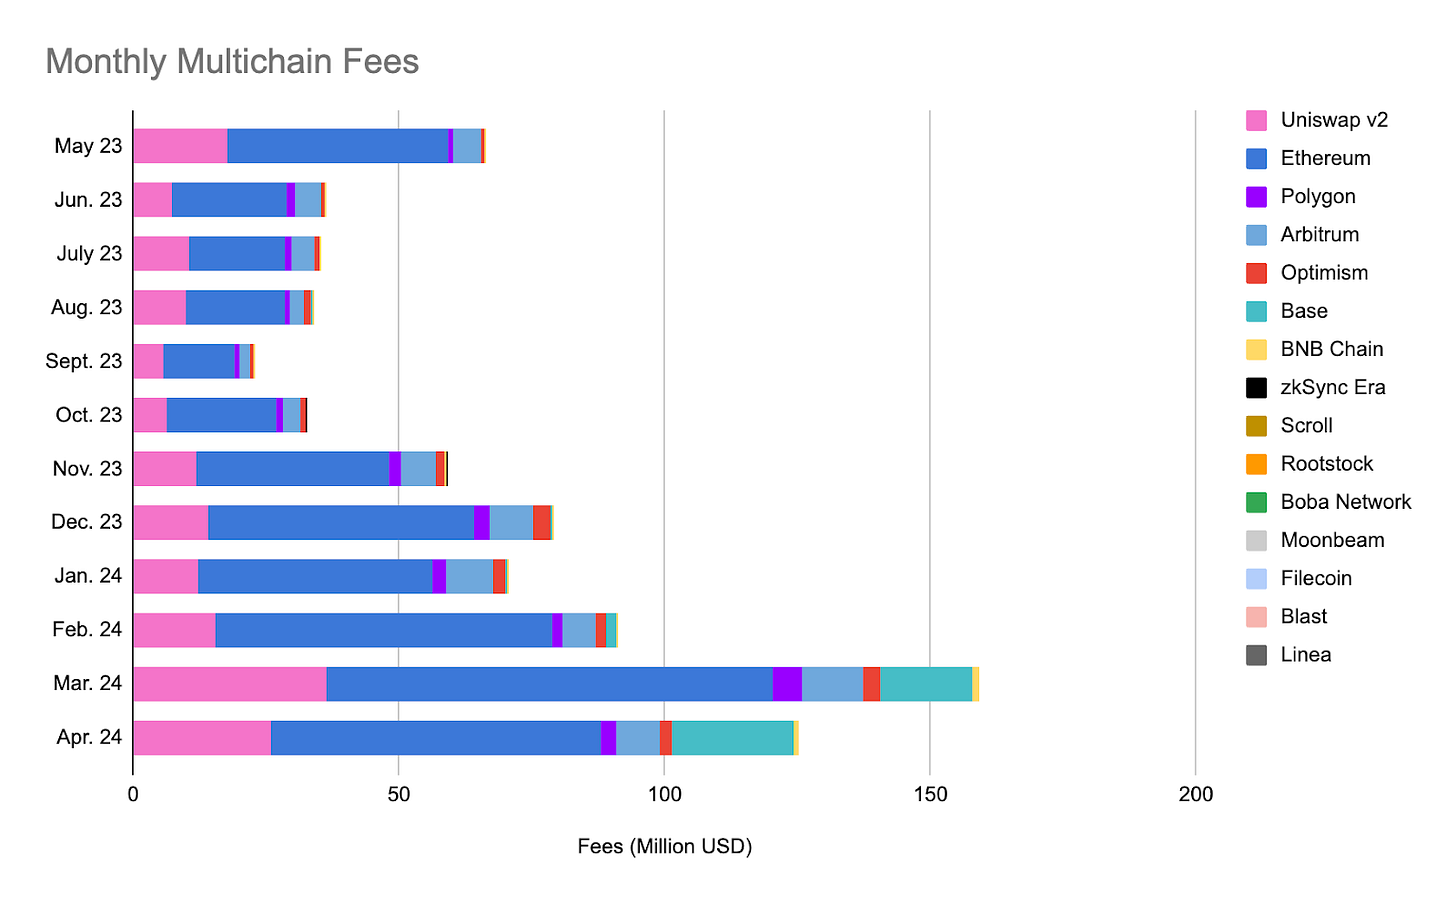
Protocol fees fell in April (-21.3%), along with the decline in volume (-14%) and liquidity (-11.9%).
The three charts show fees as the protocol metric with the highest volatility, as fees change with volume and the fee tier associated with each pool. In April, the fall in fees outdid the decline in volume, highlighting a move towards lower fee-tier pools.
Intuitively, the three chains with an increase in volume (Base, Rootstock, and Scroll) also paid more fees to liquidity providers this month than in March. In addition, zSync Era saw a slight increase in fees (+11.7%) despite a 16.2% fall in volume this month, displaying a move to higher fee pools on the Layer 2.
Base’s fees grew 32.6% in April alongside a 38.8% fall in liquidity, earning liquidity providers an extra $0.84 per dollar allocated into the protocol in April.
Market Share
This section highlights Uniswap Protocol's success against leading competitors. To be considered a competitor, the protocol must be a spot DEX with at least one deployment on a chain alongside Uniswap v3. To filter out the data, the spot DEX must have a minimum January 2024 volume of $1 billion.
Pancakeswap, Curve, Camelot, TraderJoe, Quickswap, Balancer, and Maverick meet this criterion.
Volume
Uniswap’s volume market dominance rose to 59.4% in April, primarily due to the 32.3% fall in volume from the competitor set.
After an outstanding March, volume fell on every monitored DEX. Curve and Balancer were the only two not to see double-digit declines, falling 6.4% and 9.3%, respectively. The worst performer is TraderJoe, which lost 71.1% of its volume in one month.
Liquidity
The Uniswap protocol grew its liquidity dominance to 52.8% in April after accounting for over 50% of competitor-set liquidity for the first time in March.
This month, every DEX competitor in the set experienced a 10%+ TVL drop-off. Uniswap performed the best, only losing 11.9% of its liquidity, whereas the other DEXs all had losses between 13% and 26%.
It’s important to note that liquidity is dollar-denominated, meaning that liquidity losses are not necessarily withdrawals from the protocol, but also due to falling prices, as we saw in April.
Fees
Uniswap’s share of fees generated grew once again in April. The protocol now accounts for nearly double the fees as the sum of its competitors at $125.3 million this month.
Besides Balancer, who marked a 1.3% growth, every leading DEX had a 15%+ decline in fee revenue for liquidity providers. Traderjoe and Maverick took the largest hit at -69.3% and -40.7% respectively.
The market share declines from TraderJoe and Pancakeswap were directly moved to Uniswap, who grew 5.1% this month, even with the absolute decline in fee revenue.
Layer 1 & Layer 2
This section explores the changes in Uniswap Protocol activity between Layer 1 and Layer 2 deployments as a percentage of total activity. Only Uniswap v2 and v3 on Ethereum are counted as Layer 1 deployments, with Polygon, Optimism, Arbitrum, Base, zkSync, Scroll, Rootstock, Linea, Blast, Boba, and Moonbeam making up the Layer 2 grouping.
Volume
The split between Layer 1 and Layer 2 volume remained stable from March to April. The Base deployment made up for the decreases in volume elsewhere, highlighting that capital is likely moving from other Layer 2’s to Base and not necessarily from Ethereum.
Liquidity
The liquidity share of Layer 2 deployments fell slightly in April. Since it’s been tracked, we’ve yet to see any meaningful changes in this plot, with the split hovering around 88%/12%.
Fees
Layer 2’s percentage of protocol fees hit another all-time high in April at 29.2%. This run has been primarily fuelled by Base, which has 98.8x the fee revenue it did in January of this year.
Second-Order Values
We analyzed the second-order values of the Uniswap Protocol against those of its competitors. These data sets divide Uniswap v2 and v3 to highlight the differences in design and outcome.
Protocol Efficiency
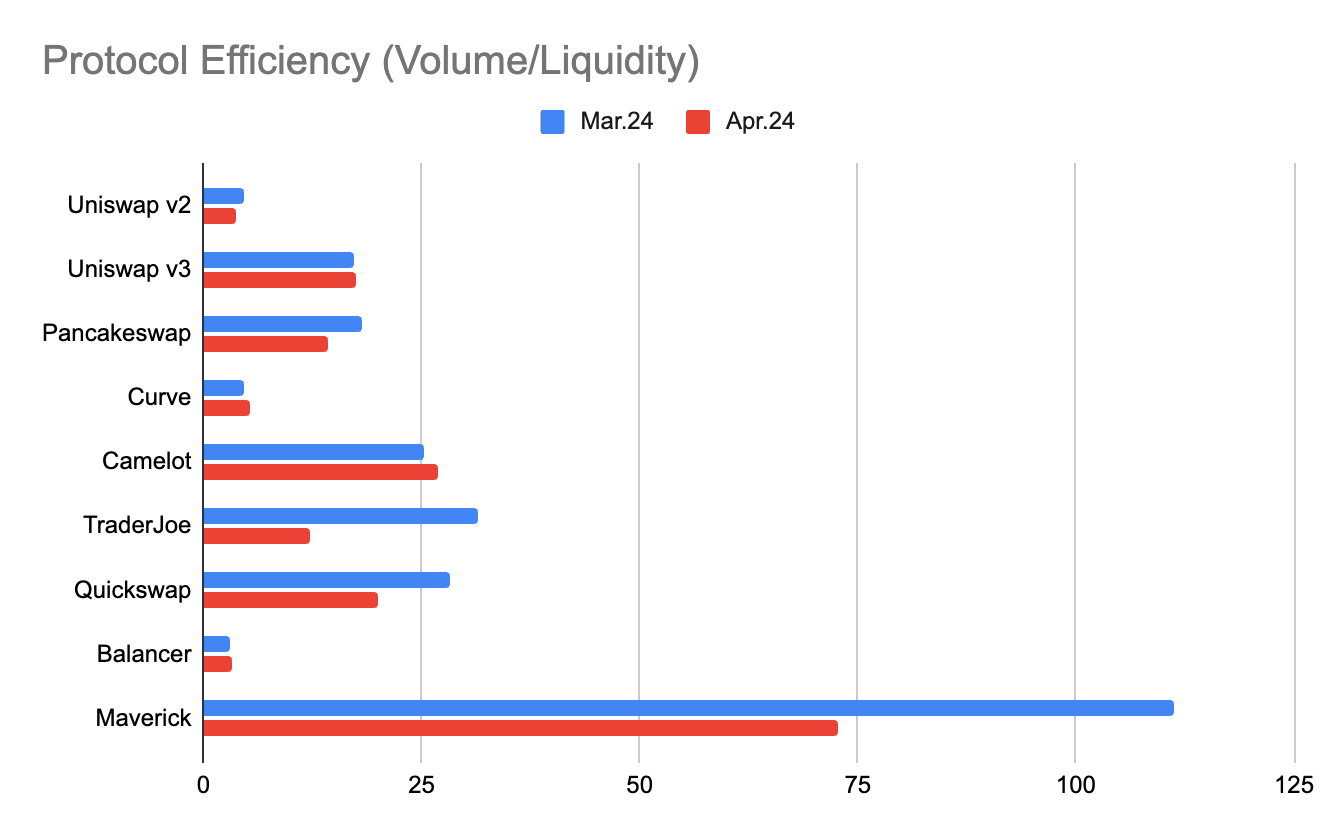
Protocol efficiency is measured by dividing the total volume by the total liquidity - finding how much volume is generated per dollar of liquidity.
Since beginning to track this stat in January, each DEX has had a relatively consistent protocol efficiency, especially Uniswap v2 and v3. This month, the bigger movers were TraderJoe, due to their substantial decline in volume, and Maverick, which varies due to their large multiplier.
Fee Rates
The average fee rate is measured by dividing fees by volume - determining the fee rate on each dollar of volume.
Uniswap v2 maintains the highest fee rate at 0.30%, as expected. Maverick retains the lowest fee rate among the DEXs, and Curve sees a decline in fees, disproportional to the protocol’s slight volume decline.
Protocol Yield
A protocol’s yield is found by dividing fees by liquidity - displaying the monthly return per dollar deposited.
Every DEX except Camelot and Balancer experienced a decrease in return per dollar deposited this month. The best destination for provisioners in April was Camelot, yielding a 3.5% return in April alone. The worst liquidity return was once again on Balancer, with a 0.1% monthly yield.
UNI Token
In April, the Uniswap Protocol's governance token, UNI (-42.6%), massively underperformed ETH (-15.3%) and underperformed against the industry’s largest asset, BTC (-16.4%).
Uniswap’s UNI token was the second worst-performing DEX token in the competitor set, with only Maverick’s MAV token coming in below. As a whole, DEX tokens did poorly in April, with Balancer’s BAL token performing the best at -30.1%.
The data from this report was sourced from the Oku API, Oku Analytics, DeFiLlama, and TradingView charting. Subscribe to the newsletter for the May report and more updates on the performance of the Uniswap Protocol across chains and against competitors.


