Uniswap Monthly Financial Report & Analysis - August ‘24
This report covers the performance of the Uniswap Protocol and UNI token leading up to and including August 2024.
Table of Contents
Executive Summary
Multichain (Volume, Liquidity, Fees)
Market Share (Volume, Liquidity, Fees)
Layer1 vs Layer2 (Volume, Liquidity, Fees)
Second-Order Values (Protocol Efficiency, Fee Rates, Protocol Yield)
UNI Token
Executive Summary
In August 2024, the Uniswap Protocol processed $55.23 billion in monthly volume (-6.4%) across $5.18 billion in liquidity (-18.6%), earning market makers $69.4 million in fees (-9.2%).
Across all chains, Ethereum saw the most Uniswap volume with $29.91 billion in v3 pools, seconded by Arbitrum. Of the major deployments, Polygon held up best in volume, liquidity, and fees.
This month, the protocol experienced a relative decline in volume (-3.8%), liquidity (-2.2%), and fees (-1.8%) over competing DEX protocols.
Layer 2 deployments’ share of volume and liquidity remained flat at 31.4% and 13.3%, respectively, while their fee share fell 3% month-over-month to 19.4%
This month, the recent Uniswap v3 deployment on Mantle was added to the report.
Multichain
This section highlights activity across each major chain with a Uniswap deployment and informs on the absolute growth of the Uniswap Protocol and its relative growth across multiple chains.
Only chains with high-quality API data are included.
Volume
Uniswap protocol volume has been consistent over the past three months at just under $60 billion. In August, this figure fell slightly to $55.23 billion.
In August, there were some changes in volume composition across the leading Uniswap v3 deployments. Base’s market share (-1.7%) went to Arbitrum (+1.8%), and Ethereum’s market share (-1%) was directed towards Uniswap v2 (+0.5%) and Polygon (+0.6). Scroll, Blast, and Linea each experienced large volume declines with at least a 60% drop from July. Filecoin and Boba network grew their volumes by 128.1% and 241.2% respectively.
Liquidity
Uniswap protocol liquidity experienced large declines in August, down 18.6% month-over-month to the lowest levels seen since January. With ETH down 24.2% in the month, this fall may be primarily attributed to price declines rather than the closing of positions in the protocol.
This month, liquidity fell significantly across all the major deployments except for Polygon and BNB Chain, where there wasn’t significant growth either. Base (-60.5%) and Manta (-85.4%) were the biggest losers. Base liquidity has been falling lately due to memecoin collapse and a shift towards Aerodrome’s Uniswap v3 fork. Taiko doubled its TVL in August.
Relatively, Ethereum grew its market share despite losing 15.1% of its TVL, and Base lost 2.6% of its market share, cutting its prominence in half.
Fees
Protocol fees fell slightly in August, alongside volume decreases, with the protocol paying the lowest amount to liquidity providers so far in 2024.
As expected, fee figures across the multichain deployments followed the volume figures. Interestingly, Base lost twice as much fee market share (-3.4%) as they did volume market share (-1.7%), signifying that high-fee tier volume fell off a cliff in August.
Market Share
This section highlights Uniswap Protocol's success against leading competitors. To be considered a competitor, the protocol must be a spot DEX with at least one deployment on a chain alongside Uniswap v3. To filter out the data, the spot DEX must have a consistent monthly volume of $1 billion.
Pancakeswap, Curve, Camelot, TraderJoe, Quickswap, Balancer, and Aerodrome meet this criterion.
Volume
Uniswap’s market dominance fell 3.8% to 53.6% in August. Uniswap protocol volume declined, and the competitor set increased volume this month.
Camelot (+17.1%), TraderJoe (+19.7%), Quickswap (+18.7), and Aerodrome (+35.7) were the big winners in August, all increasing their volume figures by 17% or more - with Aerodrome doing twice that. There has been a clear volume shift from Uniswap v3 on Base to Aerodrome.
The Uniswap protocol was the worst performer this month, losing 3.8% of its market share. Despite the poor performance, the protocol maintains over a 50% share in spot DEX volume amongst its competitors.
Liquidity
For the first time in 2024, the Uniswap protocols liquidity share dipped below 50%, now sitting at 49.9% of the total.
This month, each protocol except TraderJoe had a fall in TVL, measured in dollars. As mentioned earlier in the report, this can be primarily attributed to the decline in prices throughout the ecosystem.
The Uniswap protocol lost more liquidity than the rest, with market share flowing from Uniswap (-2.2%) primarily to Pancakeswap (+1%) and Curve (+0.6%).
Fees
Despite the liquidity parity and large decline in volume share, the Uniswap protocol remains king in fee distribution, still paying 62.9% of all fees to liquidity providers.
TraderJoe followed its best month of the year in July with another outstanding fee performance in August, growing 21.5%. Quickswap was the only other DEX to generate similar growth at 23.5% month-over-month. Despite seeing volume growth, Curve declined its fees generated by 26.8% in August, being the only DEX with double-digit fee declines. The Uniswap protocol was the next worst performer, with fees falling 9.2%.
Relatively, the Uniswap protocol was by far the biggest disappointment this month, losing 1.8% of its market share.
Layer 1 & Layer 2
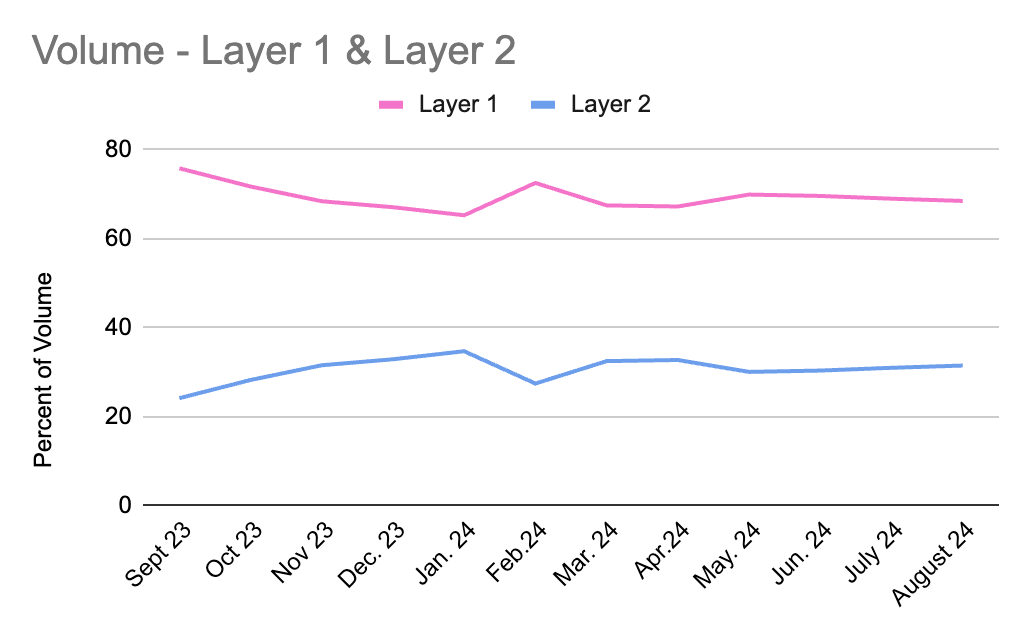
This section explores the changes in Uniswap Protocol activity between Layer 1 and Layer 2 deployments as a percentage of total activity. Only Uniswap v2 and v3 on Ethereum are counted as Layer 1 deployments, with Polygon, Optimism, Arbitrum, Base, zkSync, Scroll, Rootstock, Linea, Blast, Manta, Boba, Taiko, Sei, Mantle, and Moonbeam making up the Layer 2 grouping.
Volume
Layer 2’s volume share remains flat from March to August at roughly 31.% of the total.
Liquidity
Layer 2’s liquidity share remained flat once again in August. Without large swings in volume, we can expect this chart to stay steady as liquidity is sticky, especially in periods of flat volume metrics across Ethereum and Layer 2s.
Fees
Layer 2’s fee share fell slightly in August, primarily driven by Base’s $2.9m decline in fee generation this month.
Second-Order Values
We analyzed the second-order values of the Uniswap Protocol against those of its competitors. These data sets divide Uniswap v2 and v3 to highlight the differences in design and outcome.
Protocol Efficiency
Protocol efficiency is measured by dividing the total volume by the total liquidity - finding how much volume is generated per dollar of liquidity.
Protocol efficiency rose across the board in August, with liquidity falling and volume remaining flat across most protocols. Camelot experienced the biggest uptick this month, with a 17.1% rise in volume and a 7.1% decline in liquidity. Camelot and TraderJoe are in a category of their own, facilitating $30+ of volume per dollar of liquidity.
Fee Rates
The average fee rate is measured by dividing fees by volume, determining the fee rate per dollar of volume.
Uniswap v2 maintains the highest fee rate at 0.30%, as expected. The remainder of the fee rates remained relatively flat, with Uniswap v3 staying consistent for the last few months at 0.1% on average across all pools.
Protocol Yield
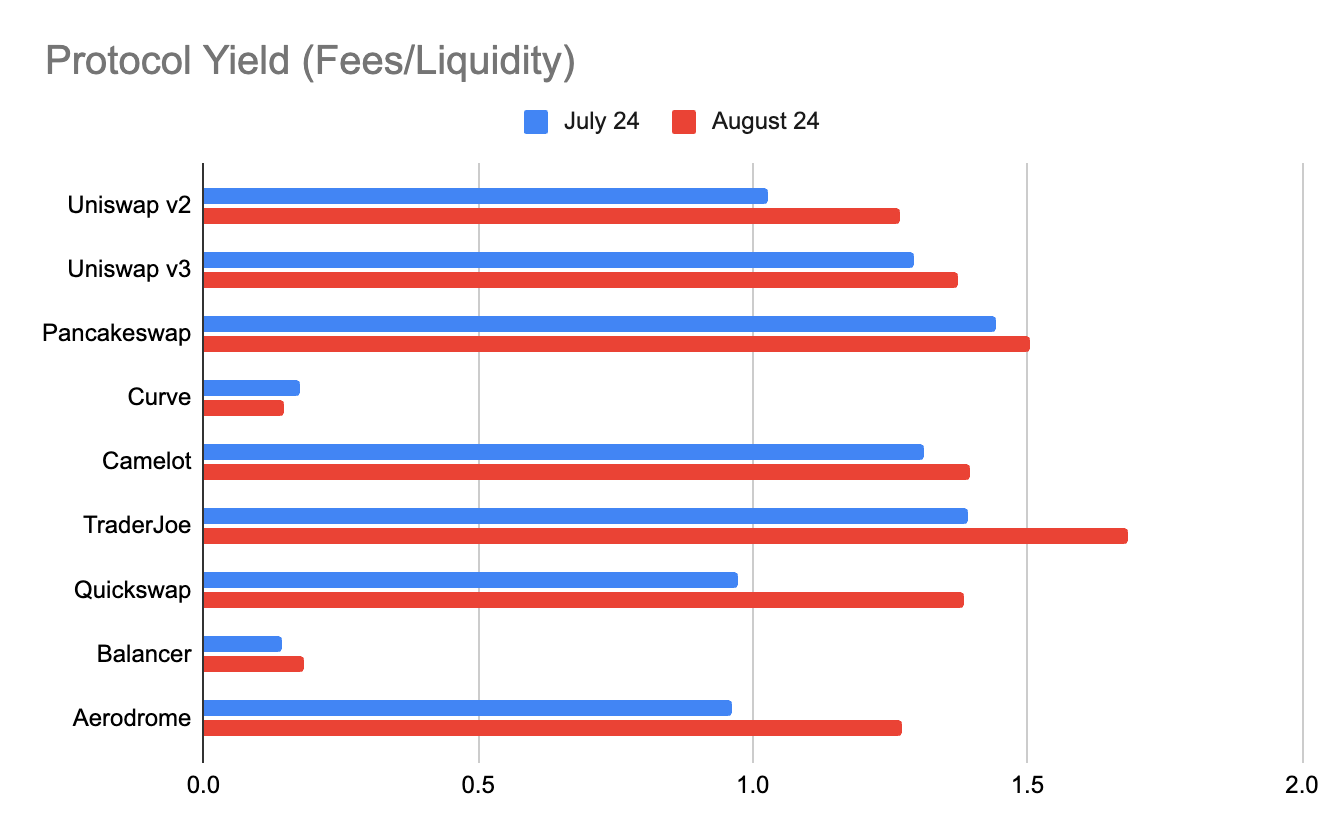
A protocol’s yield is found by dividing fees by liquidity - displaying the monthly return per dollar deposited.
Liquidity providers across the major DEXs had great earnings in August, with seven of the nine monitored DEXs offering over 1% in yield this month. Without surprise, Curve and Balancer, primarily known for their stable/stable pairs have been consistently offering a lower rate of return for their low-risk liquidity providers.
UNI Token
After a poor month in July, the Uniswap Protocol's governance token, UNI (-21.7%), performed similarly to ETH (-24.2%) and worse than the industry’s largest asset, BTC (-12.2%).
Uniswap’s UNI token was one of the worst performers this month, with only Balancer BAL (-25.6%) and Aerodrome’s AERO (-33.4%) coming in below. The best DEX token to hold in August was Camelot’s GRAIL, the only one to come out positive at +1.4%.
The data from this report was sourced from the Oku API, Oku Analytics, DeFiLlama, and TradingView charting. Subscribe to the newsletter for the September report and more updates on the performance of the Uniswap Protocol across chains and against competitors.


