Uniswap Monthly Financial Report & Analysis - March '24
This report covers the performance of the Uniswap Protocol and UNI token leading up to and including March 2024.
Table of Contents
Executive Summary
Multichain (Volume, Liquidity, Fees)
Market Share (Volume, Liquidity, Fees)
Layer1 vs Layer2 (Volume, Liquidity, Fees)
Second-Order Values (Protocol Efficiency, Fee Rates, Protocol Yield)
UNI Token
Executive Summary
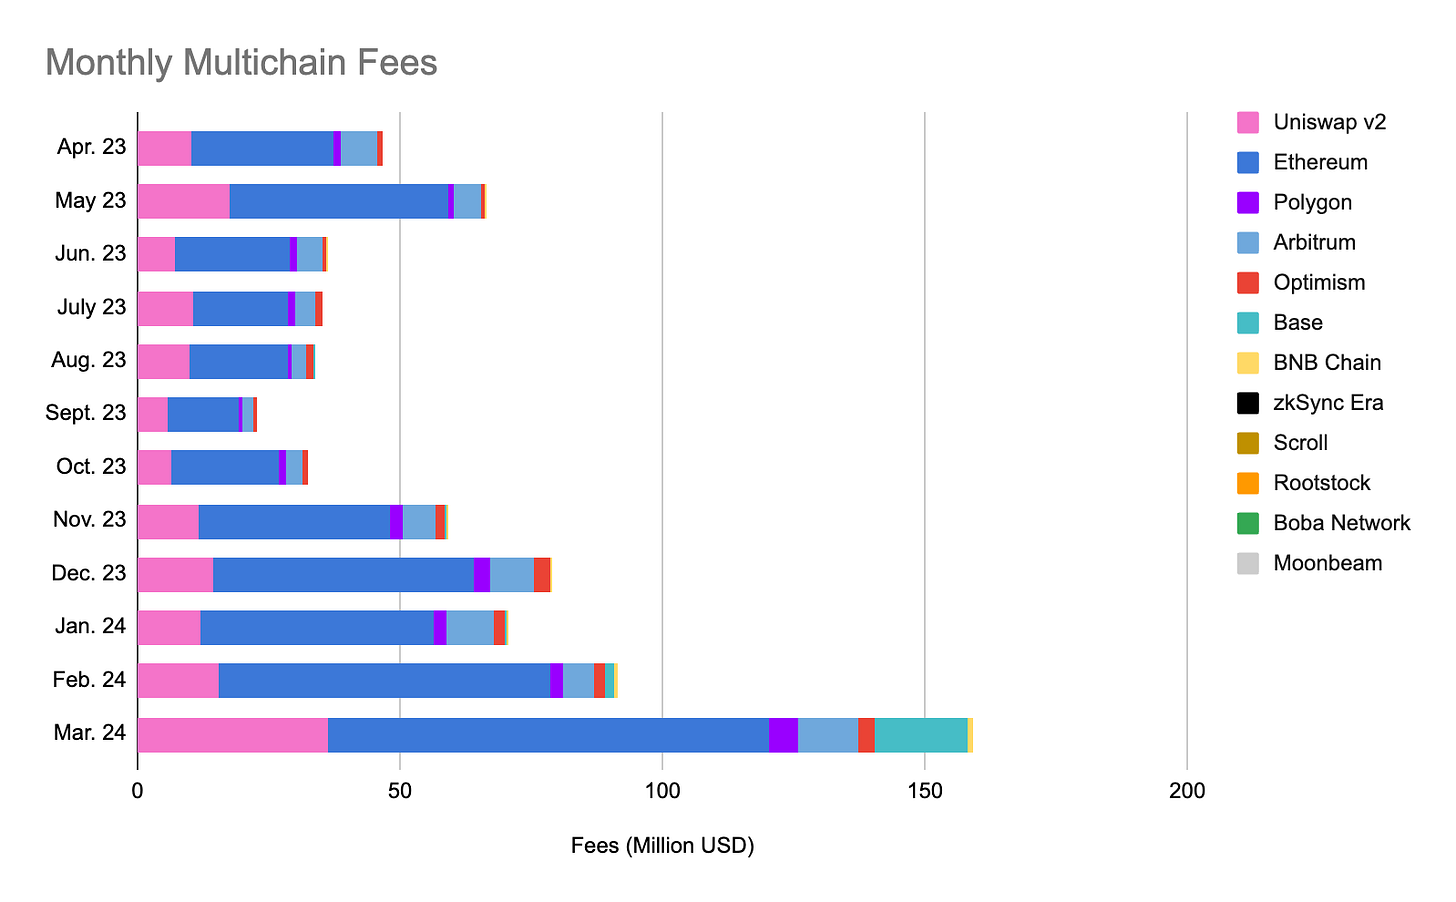
In March 2024, the Uniswap Protocol processed $90.11 billion in monthly volume (+97.1%) across $7.11 billion in liquidity (+18.9%), earning market makers $159.25 million in fees (+73.3%).
Across all chains, Ethereum saw the most Uniswap volume with $47.1 billion in v3 pools, seconded by Arbitrum. Base saw the highest month-over-month growth in volume, liquidity, and fees for the second month running.
This month, the protocol experienced a relative decline in volume of -5.2% over competing DEX protocols, with a 6.4% relative increase in liquidity and a -7.9% change in fees generated.
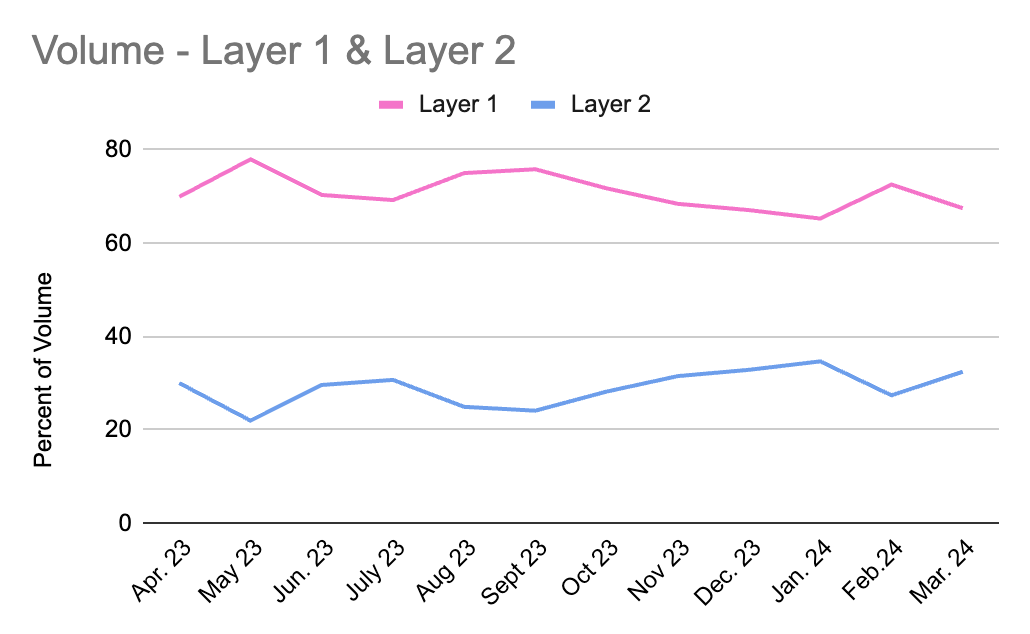
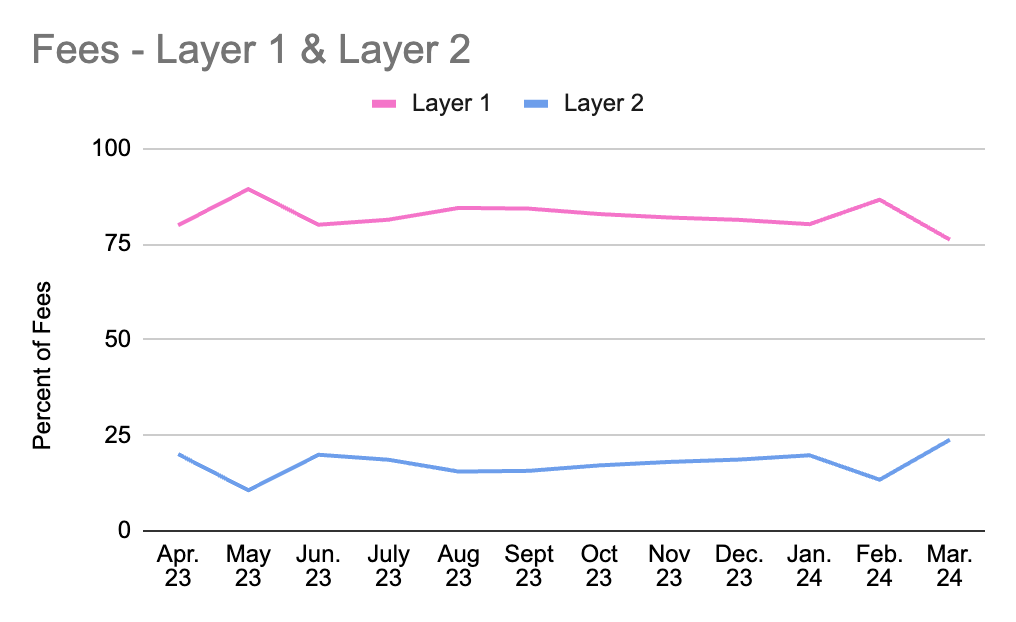
Layer 2 deployments received 32.5% of all Uniswap volume, up from 27.4% in January. Layer 2 liquidity increased to its yearly high at 13.7% of the total, generating 28.3% of fees, up significantly from last month.
Multichain
Highlighting activity across each major chain with a Uniswap deployment, this section informs on the absolute growth of the Uniswap Protocol and the relative growth across multiple chains.
Only chains with high-quality API data are included.
Volume
In March, the Uniswap protocol nearly doubled its monthly volume to $90.11 billion, marking a yearly high with no close second.
In March, protocol volume skyrocketed 97.1%, surpassing $90B in volume for the first time since December 2021. Although most of the absolute growth came from Ethereum deployments, every multichain deployment, excluding Scroll and zkSync, saw at least a 100% increase in volume. Base was once again the biggest winner, with a shocking 545% increase in volume.
Relatively, Base also saw the largest increase in volume share, growing its piece of the pie by 3.3%. Uniswap v2 also performed well, marking 1.7% relative growth. Despite growing volume by 72.6%, Uniswap v3 on Ethereum is the biggest loser, marking a 7.4% loss in market share.
Liquidity
Uniswap liquidity surged again this month, marking yet another yearly high of $7.19 billion. From the chart below, we can see that Uniswap v2 and v3 on Ethereum have been consistently growing throughout 2024. Also contributing to the protocol’s liquidity growth is the Base deployment’s exponential liquidity increases since it was launched in August 2023.
There were significant liquidity changes in March. Base marked an unprecedented 645% increase, growing its share to 5% of protocol liquidity. Along with volume falloffs, Scroll had liquidity losses, with 39.6% of TVL flowing out of the deployment.
As incentives continue to be rolled out on newer Uniswap v3 deployments, we’ll monitor liquidity growth across the selected chains.
Fees
March was a good month for Uniswap liquidity providers. Liquidity increased 18.9%, and provisioners accrued a 74.3% increase in fees compared to February. This is not surprising after noting the nearly 100% increase in protocol volume.
With fee increases not quite keeping up with volume, we can conclude that in March, volume moved towards lower fee-tier pools.
Uniswap v3 deployments on Base, BNB Chain, Moonbeam, Polygon, and Rootstock all saw 100%+ increases in fees earned compared to February. Uniswap v2 also grew its fees for liquidity providers by 133% while collecting nearly a quarter of total Uniswap protocol fees.
Interestingly, Polygon's volume grew 129.4% in March while decreasing liquidity by 10.2%. Given the 147.4% monthly increase in fees generated, Polygon liquidity providers are making 26.8% more per dollar deposited than just one month ago.
Market Share
This section highlights Uniswap Protocol's success against leading competitors. To be considered a competitor, the protocol must be a spot DEX with at least one deployment on a chain alongside Uniswap v3. To filter out the data, the spot DEX must have a minimum January 2024 volume of $1 billion.
Pancakeswap, Curve, Camelot, TraderJoe, Quickswap, Balancer, and Maverick meet this criterion.
Volume
During the March madness, Uniswap’s market dominance fell to 53.5%, even while the protocol's monthly trading volume increased by 97.1%. The competitor set grew their volume by a shocking 141.7% this month.
Volume increased on every monitored DEX, with Quickswap, the worst performer, showing a 52% month-over-month increase. TraderJoe (+216.4%) and Pancakeswap (+175.6%) were the clear champions, with large increases in absolute growth and market share. Pancakeswap now accounts for a quarter of the volume of all the listed DEXs.
Liquidity
In March, the Uniswap protocol flipped all competing DEXs in total liquidity for the first time this year, now accounting for 51.6% of the competing DEX set’s liquidity.
Despite across-the-board volume growth, only Uniswap and TraderJoe saw an increase in liquidity. TraderJoe grew liquidity by 58.2%, evidently the liquidity leader in March. Curve liquidity fell 17.6%, marking the largest loss of liquidity in the group.
Generally, liquidity reacts slowly to volume changes. We’ll be looking out for liquidity increases in April to follow March’s volume.
Fees
From a fee perspective, Uniswap and its competitors grew significantly in March. Uniswap retained its title as the top location for fee accumulation but fell -7.9% in market share amidst the competitor’s 147% increase in fees paid.
Competitor fees grew directly alongside the 141.7% increase in volume, displaying very little movement in pool fee tiers.
Every qualifying DEX paid more to liquidity providers in March than in February, with TraderJoe and Pancakswap more than doubling their fees. Following volume, Pancakeswap now accounts for a quarter of all fees paid, growing its market share by 8.2% this month.
Layer 1 & Layer 2
This section explores the changes in Uniswap Protocol activity between Layer 1 and Layer 2 deployments as a percentage of total activity. Only Uniswap v2 and v3 on Ethereum are counted as Layer 1 deployments, with Polygon, Optimism, Arbitrum, Base, zkSync, Scroll, Rootstock, Boba, and Moonbeam making up the Layer 2 grouping.
Volume
After volume shifted back towards Layer 1 in February, the Uniswap protocol’s Layer 2 deployments grew to a 32.5% share of total volume in March - the second-highest percentage this year.
Unlike the jump in January, this increase is primarily fueled by the recent expansion of the Base and BNB Chain deployments.
Liquidity
March marked a new all-time high for Layer 2’s share of protocol liquidity, which was 13.7% of the total. We’ll likely see this value continue to grow as liquidity adjusts to the volume shifts and stale Layer 1 liquidity gets removed and/or reallocated.
Fees
Layer 2’s percentage of protocol fees hit an all-time high in March at 23.8%. Layer 2 trading has slightly shifted towards higher fee-tier pools, where liquidity providers are now earning 97.3% more per dollar deposited.
Second-Order Values
We analyzed the second-order values of the Uniswap Protocol against those of its competitors. These data sets divide Uniswap v2 and v3 to highlight the differences in design and outcome.
Protocol Efficiency
Protocol efficiency is measured by dividing the total volume by the total liquidity - finding how much volume is generated per dollar of liquidity.
Month over month, there is an increase in this metric, with volume outpacing liquidity on every leading DEX.
The competing DEXs form three distinct tiers. Maverick still maintains the highest protocol efficiency by a large margin in a group of its own. Uniswap v3, Camelot, TraderJoe, Pancakeswap, and Quickswap are in the next tier between a 15x and 35x volume-to-liquidity multiplier. The poorest performers in this category are Uniswap v2, Curve, and Balancer, with multipliers less than 5x.
Fee Rates
The average fee rate is measured by dividing fees by volume - determining the fee rate on each dollar of volume.
Uniswap v2 maintains the highest fee rate at 0.3%, as expected. Maverick retains the lowest fee rate among the DEXs, likely due to its liquidity incentives, which are not accounted for in fees collected.
Protocol Yield
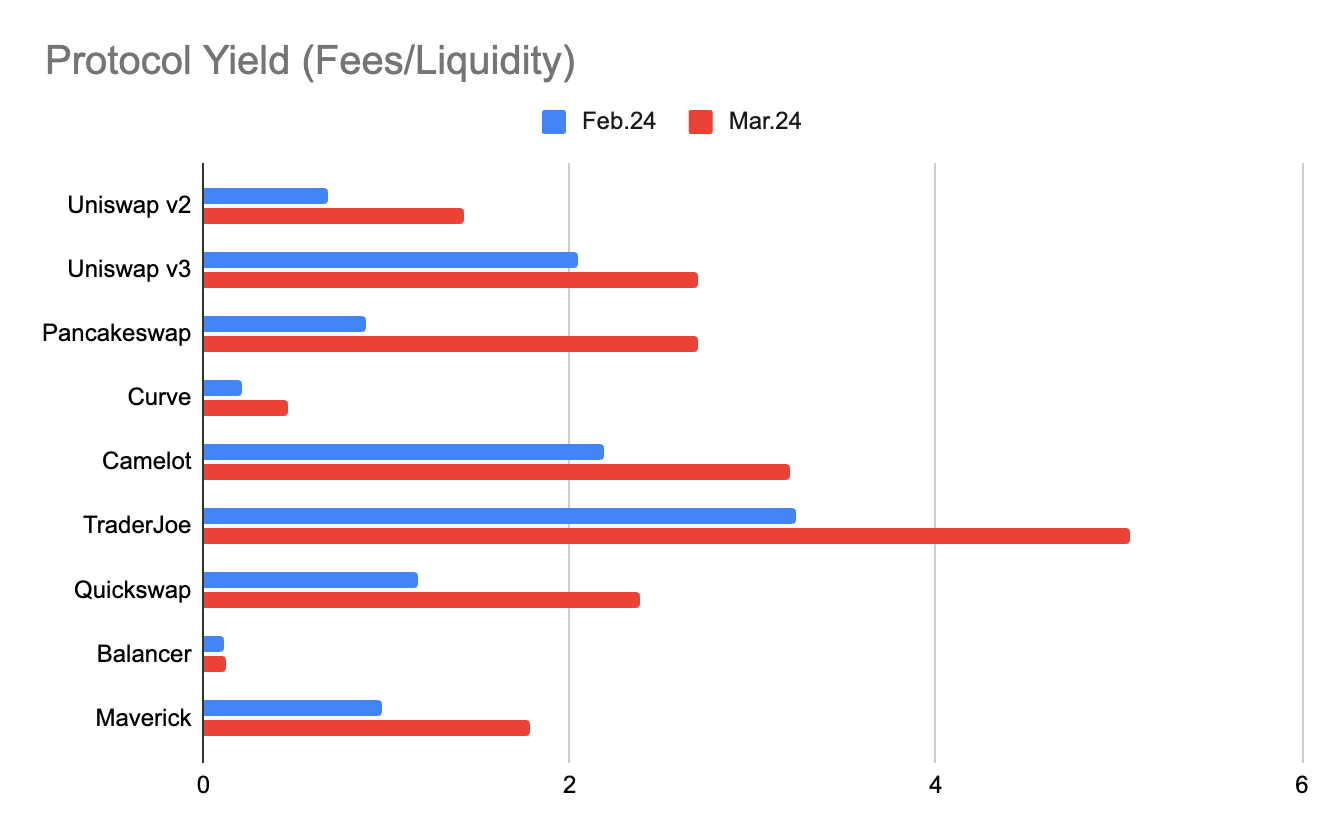
A protocol’s yield is found by dividing fees by liquidity - displaying the monthly return per dollar deposited.
Every DEX saw an increase in return per dollar deposited this month. The best destination for provisioners in March was TraderJoe, yielding a shocking 5.1% return in March alone. The worst liquidity return was on Balancer, with a 0.1% monthly yield.
UNI Token
In March, the Uniswap Protocol's governance token, UNI (+1.9%), performed at par against ETH (+2%) and underperformed against the industry’s largest asset, BTC (+11.6%).
.
Compared to the competition, Uniswap’s UNI token performed in the middle of the pack. CAKE, JOE, and QUICK were the clear winners at 30%+ increases. CAKE and JOE had the largest volume increases this month, but it’s likely QUICK’s price increase had less to do with onchain activity, being the worst-performing DEX in the set.
The data from this report was sourced from the Oku API, Oku Analytics, DeFiLlama, and TradingView charting. Subscribe to the newsletter for the April report and more updates on the performance of the Uniswap Protocol across chains and against competitors.


